
Before you start
Identify the parameter, sample point, period and units you want to compare. Your account needs access to the relevant results.
Add a series and review the period
- Select the intended site and open Data > Result charts.
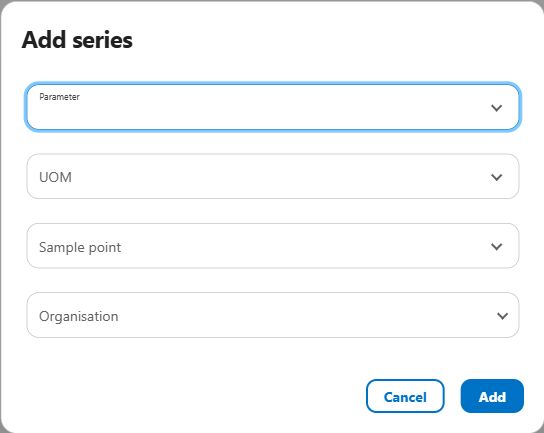
- Use the chart’s Add new action. Choose the Parameter, UOM, Sample point and Organisation, then Add the series.
- Set the period using the chart’s date-range picker.
- Review Follow filters: following links the chart period to the browser’s date context; an independent chart retains its own period.
- Use Refresh to retrieve current chart data.
- Add another series when needed, then review the legend, parameter, location, units and applicable limits before comparing trends.
Compare compatible measurements
The series menu provides colour, Pinned, Show axis and the available chart types. Use distinct colours and clear series definitions.
Reuse an axis for suitable compatible series, such as two flow rates in the same unit. Keep separate axes for different dimensions, such as flow and level. Similar positions on different axes do not represent the same numerical value.
Common problems
- The chart did not change with my search.
- Review Follow filters and the chart’s date range, then Refresh.
- A series has no expected points.
- Check its parameter, sample point, organisation, period and access to the underlying results.
- A previous series remains visible.
- Review the Pinned state and its retained parameter, location and period. Unpin or remove it when the comparison is finished.
Need help with your setup?
Your configuration and permissions affect the fields and actions available. Contact your administrator or info@aquantify.com for assistance.
Updated 9 October 2026 · Screens show the Aquantify web and mobile interfaces.