
Results graphs
A chart compares recorded values across a period. Each series identifies a parameter and sample point context. Check the date range, units, applicable limits and series type before interpreting a trend.
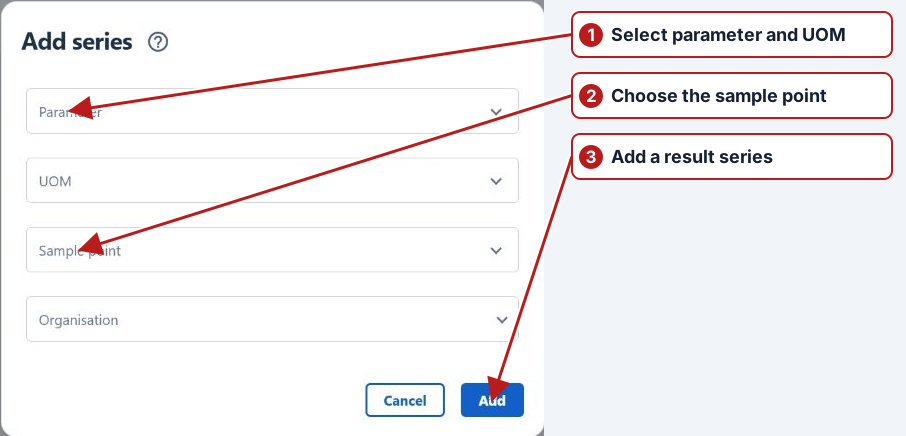
Add a series
Use the chart’s Add new action, select the required parameter and sample point context and accept the series. Add another series for each measurement you want to compare. Use distinct colours and meaningful definitions to keep the chart readable.
Timeframe and follow filters
The chart’s date-range picker sets its displayed period. Follow filters links the chart period to the browser’s date context; Do not follow filters lets the chart retain its independent period. Review that state when a browser search changes but the chart appears unchanged. Refresh retrieves the current chart data.
Series controls and graph details
The series menu provides colour, Pinned, Show axis and available chart types. Use the chart manager to select or organise chart definitions. Review the parameter and location of a series before attributing an unusual point to a particular measurement.
Limits
Limit chips show applicable classifications and minimum or maximum values with units. Select the relevant limits when comparing a trend with thresholds. A chart’s visual proximity to a line does not replace checking the underlying value and applicable limit record.
Multiple parameters and axes
Reuse axis combines suitable compatible series. Two flow rates in the same unit can share an axis. A level in metres and a flow in L/s need separate axes, and similar positions on those axes do not imply similar numerical magnitudes.
| Comparison | Axis choice |
|---|---|
| Inlet and outlet flow in L/s | A shared axis can support direct comparison |
| Flow and tank level | Separate axes preserve different dimensions |
| Concentrations in different compatible units | Review conversions and displayed units first |
Managing pinned series
Pin a series when it should remain available while the browsing context changes. Review the pinned parameter, location and date context so a retained series is not mistaken for the newly selected result. Unpin or remove a series when the comparison is finished.
Sharing the evidence
Use an export or capture action where the current view offers it, or capture the displayed chart with its date range, legend and units. The Windows clipboard-copy controls described in the old help are not the controls shown by this web view. For numerical analysis, export the filtered results separately.
See Multiple-parameter graphing and Export results.
Save and share a chart
See Manage saved charts for pinned series, folders, sharing roles and dashboard reuse.