
Compare multiple result series
Use Data > Result charts to compare result series over a date range.
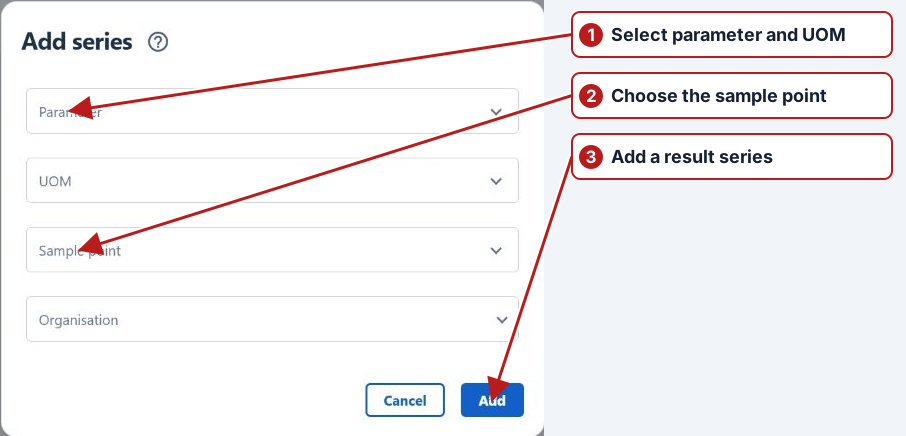
Add series
- Open Data > Result charts and choose the date range.
- Click Add new.
- Select Parameter, UOM, Sample point and Organisation as required.
- Click Add and repeat for other series.
Adjust the chart
Use the series menu to change colour and chart type, pin the series, show its axis, edit it or remove it. Reuse axis controls shared axes. Use Refresh to reload the data.
Save a chart
Open Manage chart > Save as new to save the chart configuration. Use Search chart to find saved charts, or Clear to remove the current series.
Example: compare related measurements
Add inlet flow and outlet flow for the same period to compare their changes. Add a tank-level series to investigate whether storage changed at the same time. Review missing results and source dates before interpreting a lag or sudden change.
| Series | Unit | Interpretation |
|---|---|---|
| Inlet flow | L/s | Incoming rate |
| Outlet flow | L/s | Outgoing rate |
| Tank level | m | Storage level; use its own axis |
Reuse axis and pinned series
Use Reuse axis for the compatible flow series; keep the level on a separate axis. Pin the reference series when moving between locations, then check which location each retained series represents. Review Follow filters when changing a browser date range.
See Results graphs for series controls, timeframe, limit chips and sharing evidence.