
Manage saved charts
A saved chart retains a reusable set of pinned result series and its shared-axis setting. Use Data > Result charts to prepare the comparison, then Manage chart to save, find or update it.
Prepare and save a chart
- Add the parameter, sample-point, unit and organisation combinations you need.
- Use each series menu to set its type, colour, axis visibility and Pinned state.
- Review Reuse axis for series that can share an axis.
- Choose Manage chart > Save as new. If prompted, review the message that only pinned series will be saved.
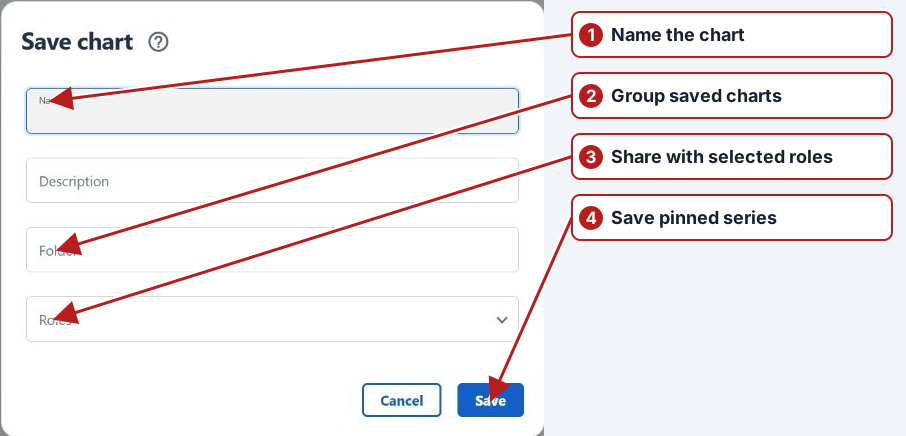
- Enter Name, Description and an optional Folder. Select the intended Roles, then click Save.
Find and reopen a chart
Open Manage chart and enter part of the name, description or folder in Search chart. Open a folder submenu where applicable and select the chart. Check its series, dates and units after loading it; a saved chart definition is not a frozen copy of the results.
Update, copy or delete
- Save
- Updates the last-used saved chart with the current pinned series and shared-axis configuration. Check the chart you loaded before using this action.
- Save as new
- Creates a separate definition. Give the copy a meaningful name and review its folder and roles.
- Clear
- Clears the current displayed series without deleting the saved definition.
- Delete
- The delete icon beside a saved chart removes that definition after confirmation.
Use a chart on a dashboard
Add a Chart widget, select the saved chart and choose its period. Use a Results chart widget when the source should instead be a saved result filter. See Dashboard widgets.
See Results graphs and Compare multiple result series for plotting and axes.