
Aquantify reporting
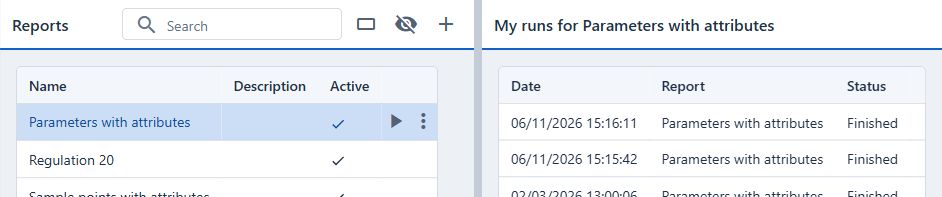
Open Data > Reports to run reports and review their output. The left pane lists report definitions. The right pane, My runs, shows the runs you started and scheduled runs for which you are a recipient, subject to your report access.
Select a report to see its runs, or click Deselect to see your full history. Drag the divider to resize the panes. Click it to hide My runs, and click again to reopen the pane at its previous width.
Choose an output format
| Format | Use |
|---|---|
| A formatted document using the report template, suitable for reading or printing. | |
| Excel | An Excel export of the template-based report. |
| Excel (from queries) | A workbook whose worksheets come from the definition’s Excel queries. It requires at least one configured query. |
Run a report
Select a report in the left pane and click its Run report play icon. Select a format and complete any parameters. When the run shows Finished, select it in My runs and use its More menu to Open or Download the output. See Run reports for the full workflow.
Standard reports and custom reporting
Date range, location and classifications can change the reported population. Users with setup permission can edit definitions from the report list.
Save the definition and its design values, then choose Edit template in the Basic toolbar on the Attributes tab. The definition guide shows where to find the button and links to FastReport’s layout documentation.
Scheduled delivery and processing
Configure recurrence, output format, parameter values and recipients on the definition’s Schedules tab. Check Background jobs for processing failures and Notifications for the outcome of an interactive request.
Browser export for analysis
Use the filtered task/result browser’s export when you need the underlying values for spreadsheet analysis. Retain qualifiers, units, dates and locations with the values.
Database views
The Windows help described custom reporting against database views. That is an administrator/developer reporting integration, not a browser menu action. Confirm the current supported dataset and access with the deployment owner before using an old view definition.