Configure a Map widget
Use a Map to plot rows from a SQL query. Add Map through Dashboard > Configure, then open its Settings.
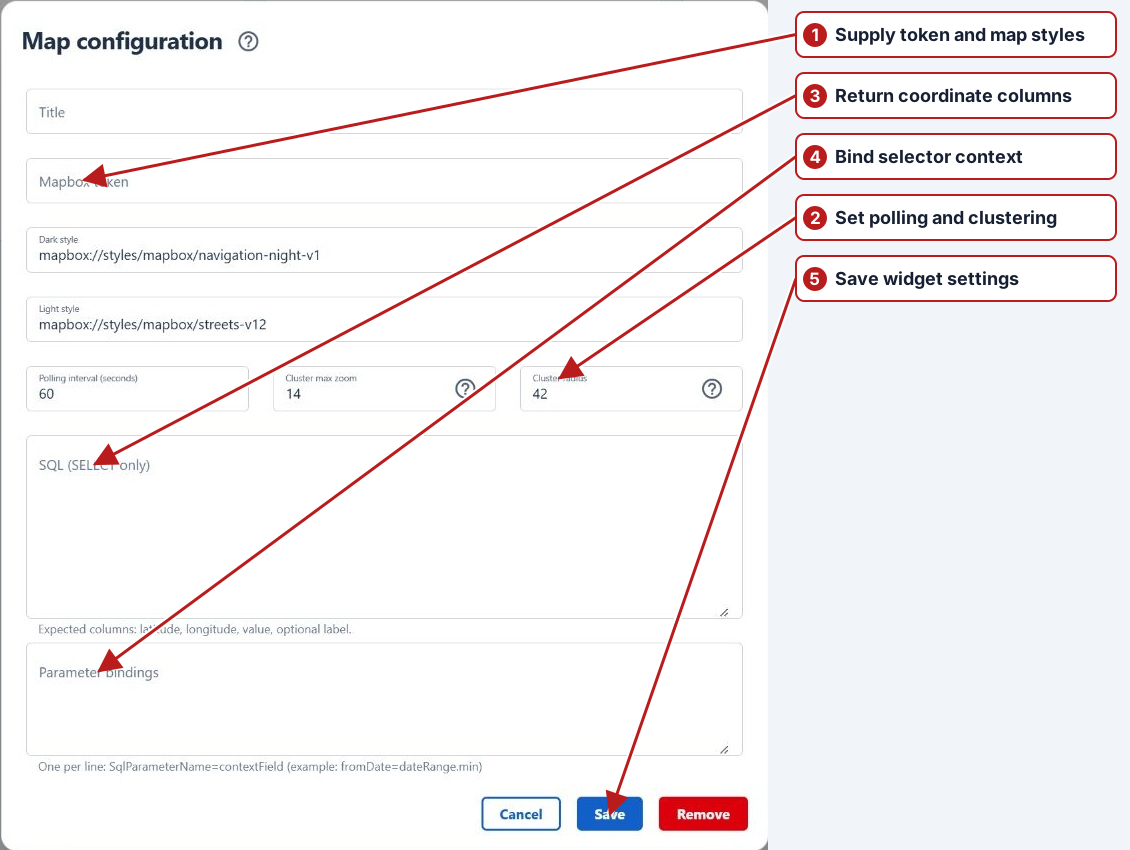
Map settings
| Field | Configuration |
|---|---|
| Title | A clear name for the data shown. |
| Mapbox token | The Mapbox access token provided for this deployment. A token and SQL are both needed to display the map. |
| Dark style / Light style | Mapbox style URLs for each theme. Defaults are mapbox://styles/mapbox/navigation-night-v1 and mapbox://styles/mapbox/streets-v12. Check both themes. |
| Polling interval (seconds) | Greater than 10; default 60. |
| Cluster max zoom | Positive zoom level; default 14. Points appear individually above this zoom. |
| Cluster radius | Grouping distance in screen pixels; default 42. Larger values combine more points. Set 0 to disable clustering. |
| SQL (SELECT only) | One SELECT returning the columns below. |
| Parameter bindings | One name=context.path per line. See SQL parameters and selector bindings. |
Required SQL output
| Column alias | Meaning |
|---|---|
latitude | Numeric latitude in decimal degrees, normally −90 to 90. |
longitude | Numeric longitude in decimal degrees, normally −180 to 180. |
value | Numeric magnitude shown in the popup and used for default point styling and cluster totals. |
label (optional) | Popup label. Missing or blank labels display “Unnamed sample point”. |
colour (optional) | Mapbox-compatible colour, for example #3f88c5, overriding the point’s default colour. |
radius (optional) | Integer circle radius in pixels, overriding the default size. |
boundary (optional) | For custom styles with a layer named Boundaries: filters that layer to features whose NAME matches a returned boundary. It does not draw polygons from SQL. |
Aliases are case-insensitive. Rows missing a finite latitude, longitude or value are excluded. Use geographic coordinates, not projected eastings and northings.
Start with a single point
This standalone example needs no tables or parameter bindings. Supply your deployment’s Mapbox token before saving:
SELECT
    CAST(-33.8688 AS decimal(9, 6)) AS latitude,
    CAST(151.2093 AS decimal(9, 6)) AS longitude,
    CAST(12.5 AS decimal(10, 2)) AS value,
    N'Example monitoring point' AS label,
    '#3f88c5' AS colour,
    12 AS radius;
Replace the constants with your reporting query and preserve the column aliases. Aggregate to one row per intended point before returning the rows. Clusters display the sum of value; their colour follows the point with the highest value. Click a cluster to zoom in and hover over a point for its label and value.
Connect selectors and save
For SQL using @fromDate and @toDate, add:
fromDate=dateRange.min
toDate=dateRange.max
The date selector must have Field name dateRange. Follow the binding guide for date conversion, list parameters and complete examples. Save the widget, then use Configure > Save on the dashboard.
If the map is blank
- Check the token and selected theme’s style URL.
- Check that the query returns the required aliases and valid numeric coordinates and values.
- Check selector context names, parameter names and the selected date range.
- If saving or loading fails, review the SQL error and permissions described in the SQL guide.
See also Table configuration and all dashboard widgets.