Dashboard widgets
Add widgets from Dashboard > Configure. Open a widget’s Settings to select its source and presentation. Arrange and resize the widgets, then save the dashboard.
Choose a widget
Open the configuration guide for your widget:
- Map: settings, required SQL columns and examples
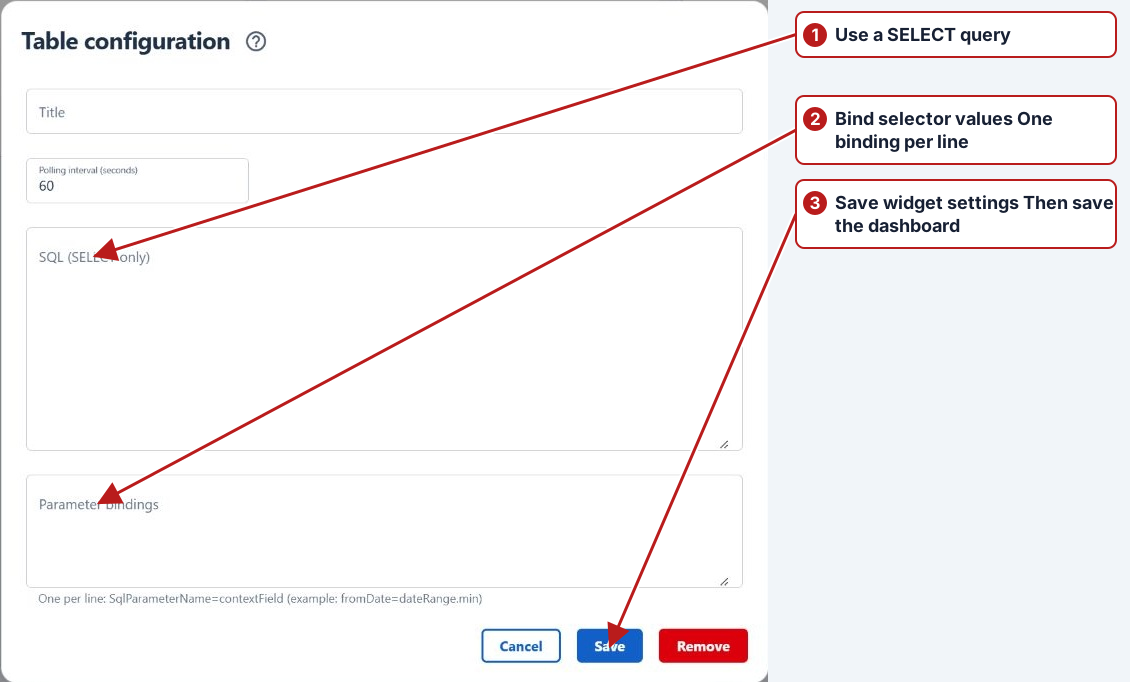
- Table: SQL output, column formatting and examples
- SQL parameters and selector bindings: dates, JSON lists and troubleshooting
- Date range configuration
- Latest result configuration
- Compliance configuration
- Custom attribute configuration
- Results chart configuration
- Chart configuration
- Results imported configuration
- Heading configuration
| Widget | Purpose and setup |
|---|---|
| Compliance | Shows compliance information grouped by the configured parameter custom attribute. Select the attribute and a meaningful title. |
| Date range | Provides a date selector for other widgets. Set its label and context field; the default field is dateRange. |
| Latest result | Shows a recent measurement for the configured parameter and location context. Check its date and unit alongside the value. |
| Results chart | Plots results from a saved source filter. Choose that filter, the number of results to take and the colour. |
| Chart | Displays a saved chart with a chosen period. Use saved chart management to prepare its pinned series first. |
| Results imported | Summarises result-import activity for the configured scope. |
| Map | Displays locations and query-derived information on a map. Configure the location and result-query settings for the intended data. |
| Table | Displays the output of a SELECT query. Set a title, polling interval and any bindings to dashboard selectors. |
| Custom attribute | Provides selections based on an entity’s custom attribute. Choose the entity type, attribute, label and context field. |
| Heading | Adds text to identify sections and explain the dashboard’s purpose. |
Link a date selector to a table
For example, a monitoring dashboard can show a date selector above a results table. Give the Date range widget the context field dateRange. In the table, bind the query’s parameters to the selector:
fromDate=dateRange.min
toDate=dateRange.max
The SQL parameters are @fromDate and @toDate. Use a query prepared for the required Aquantify dataset and its date-boundary rules. The parameter name on the left must match the SQL; the context path on the right must match the selector.
Configure a date selector
- Add Date range and open the widget’s Settings.
- Set the visible Label and its Field name, for example
dateRange. - Save the widget settings, then save the dashboard through Configure.
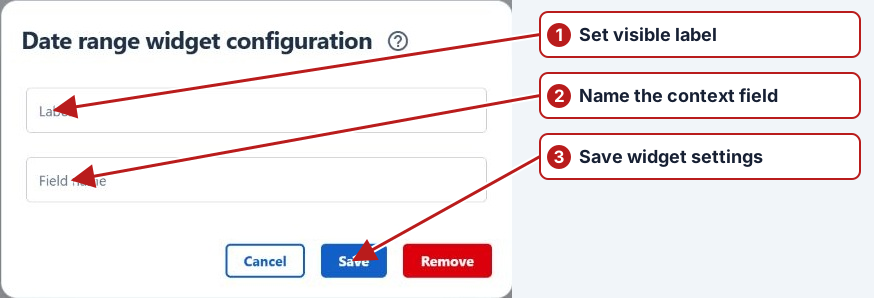
The date selector initially uses This month when no saved range is available. Changing the range updates its context value. A receiving Table or Map widget must bind its SQL parameters to that value, such as dateRange.min and dateRange.max.
Configure Latest result
- Add Latest result, point at the widget to reveal its toolbar, and open Settings.
- Enter a Title, then choose Parameter and Sample point.
- Choose an Organisation to restrict the result source, or None to leave it unrestricted by organisation.
- Select a compatible UOM where offered. Changing Parameter clears the previous unit choice, so review it again.
- Save the settings and the dashboard. Check the displayed value, unit, date and organisation.
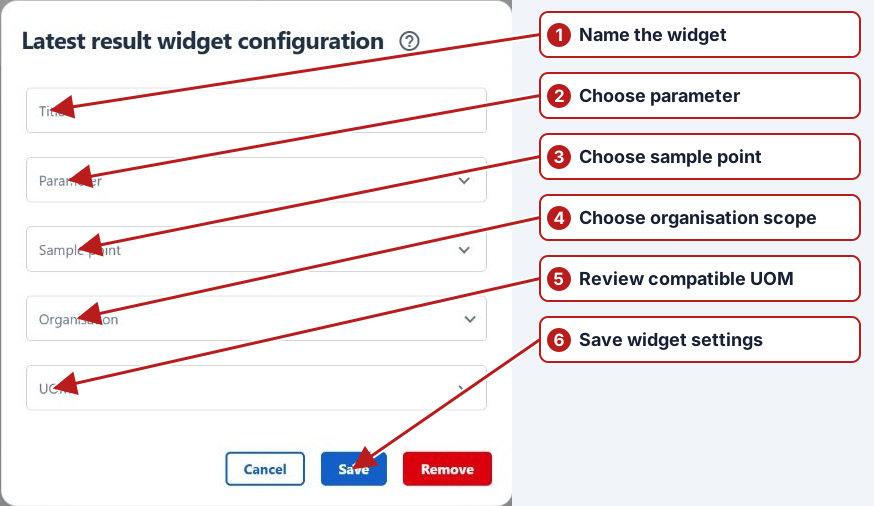
For example, use a title such as “Inlet chlorine”, choose the chlorine parameter and inlet sample point, and select its compatible unit. A latest reading may be older than today: read its date before interpreting it. Use Refresh to request it again.
Configure Compliance
- Add Compliance and open its Settings.
- Enter Title and choose the Parameter custom attribute used to group measurements.
- Set Take days to a positive number, such as 30 for the example period.
- Save the settings and the dashboard, then review the displayed groups and percentages.
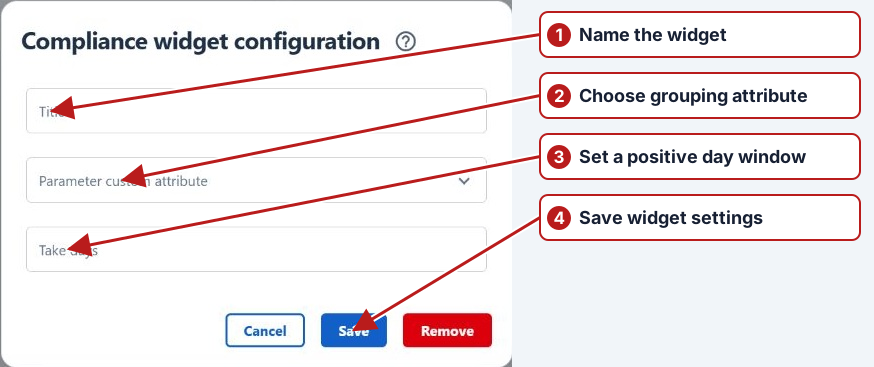
Populate the chosen attribute on the relevant parameters first. If expected groups are absent, review those attribute values and the results available in the selected number of days. Use Refresh where offered. An empty widget does not establish full compliance.
Configure a custom-attribute selector
- Add Custom attribute and open Settings.
- Select Entity, then its Attribute.
- Enter a visible Label and a distinct Context parameter name, for example
siteClasses. - Save the settings and the dashboard. Configure receiving queries to use that context name.
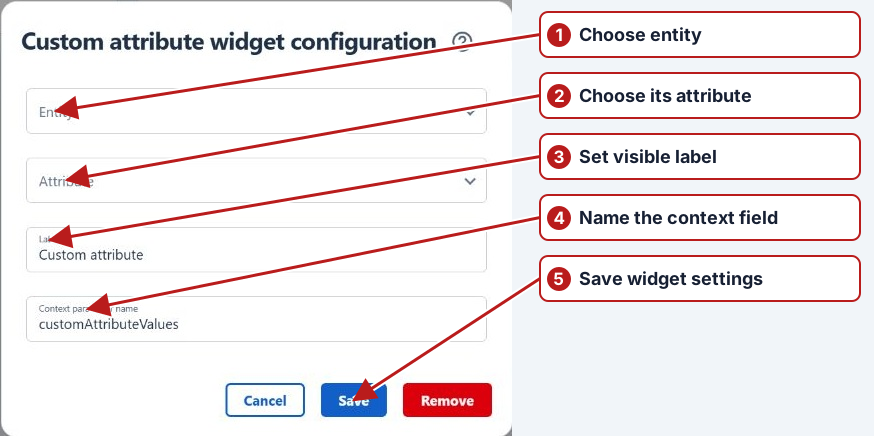
A lookup attribute offers its defined choices and stores the selected lookup IDs. A non-lookup attribute accepts comma-separated values. Both supply a list of values. The receiving query must be written to handle that list and its empty-selection case.
classes=siteClassesThis binding connects SQL parameter @classes to the selector named siteClasses. A query expecting lookup names will not receive those names when the selector supplies IDs. Use different context names for selectors that should act independently.
Configure Map
| Field | What to enter |
|---|---|
| Title | A name explaining the map’s purpose. |
| Mapbox token | The map token supplied for this deployment. |
| Dark style / Light style | The style used for each application theme. Review both even when configuring in light mode. |
| Polling interval (seconds) | A value greater than 10; the initial value is 60. |
| Cluster max zoom | The highest zoom where points are clustered. Above it, points appear individually. |
| Cluster radius | The grouping distance in screen pixels. Increasing it merges points farther apart. |
| SQL (SELECT only) | A query returning latitude, longitude, value and optionally label. |
| Parameter bindings | One SqlParameterName=contextField binding per line, as with Table. |
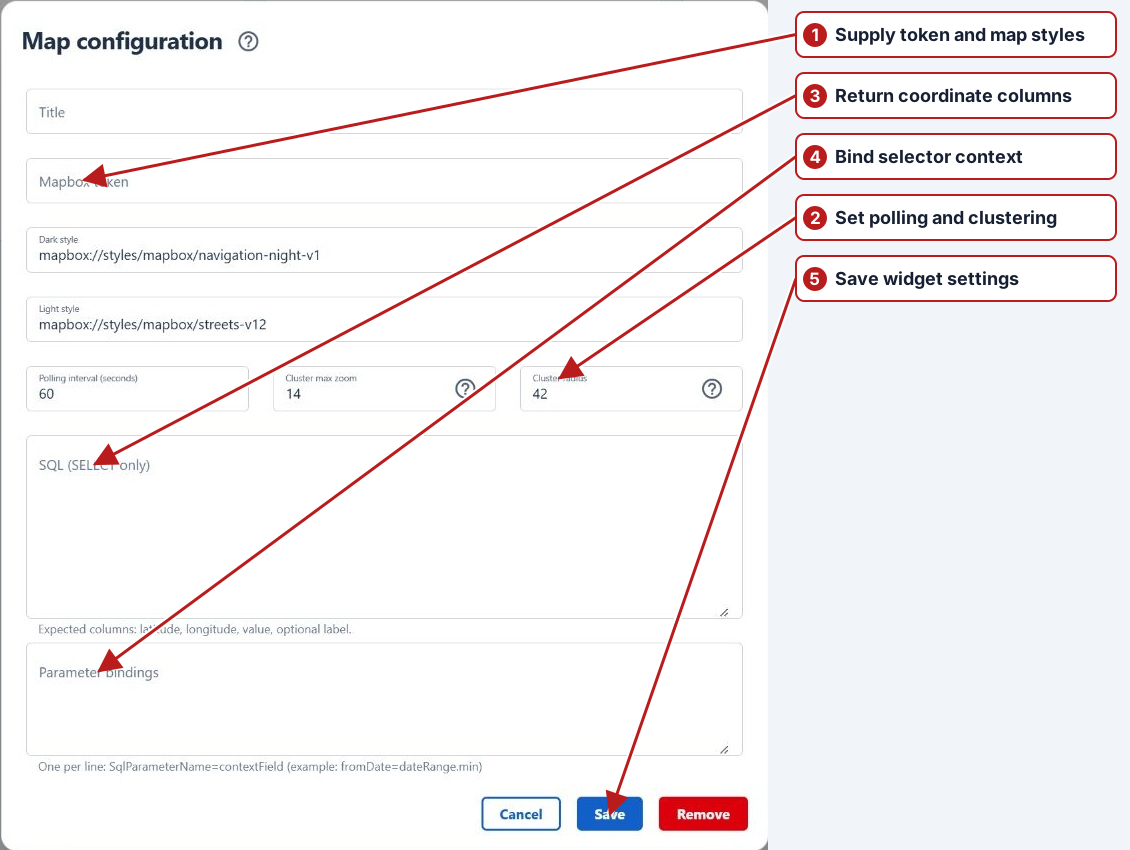
Have the reporting administrator prepare the query for the intended dataset. For a date-aware map, use the same fromDate=dateRange.min and toDate=dateRange.max bindings as the table example, with matching SQL parameters. Review coordinate columns, values and labels before saving settings and the dashboard.
Other widget settings
| Widget | Configuration steps |
|---|---|
| Table | Set Title, Polling interval (greater than 10 seconds), SELECT query and Parameter bindings. Save the widget and dashboard. The date-binding example above shows the connection. |
| Results chart | Prepare a saved Tasks filter, choose it under Source filter, enter a positive Take results count and choose Colour. Recent searches are not listed as saved sources. |
| Chart | Choose a saved Chart, Title and Period. Use Manage saved charts to prepare the pinned series. |
| Results imported | Set Title, Polling interval (greater than 10 seconds) and a positive Take last (hours), then tick at least one organisation. This widget’s window is its own hours setting. |
| Heading | Enter Text or paste formatted text from Word into the editor. Save the widget and dashboard; use headings to explain the surrounding data. |
Within a widget editor, Cancel discards its changes and Remove removes the widget after confirmation. Save the dashboard through Configure > Save to retain widget settings, additions, removals and layout changes.
Check the displayed data
- Choose a period or attribute value and check which widgets are configured to follow it.
- Review parameter, sample point, organisation and unit where shown.
- Use Refresh where available, or allow the configured polling interval to elapse.
- If a widget is empty, check its saved source, selector bindings, date range and access permissions.
A blank table or map can mean that its query returned no matching records. It does not prove that no results exist elsewhere. For a comparison, open the relevant browser with the same scope.