
Manage report definitions
Use Data > Reports to maintain report definitions. The editor and designer require Setup Reports permission.
Define a report and its parameters
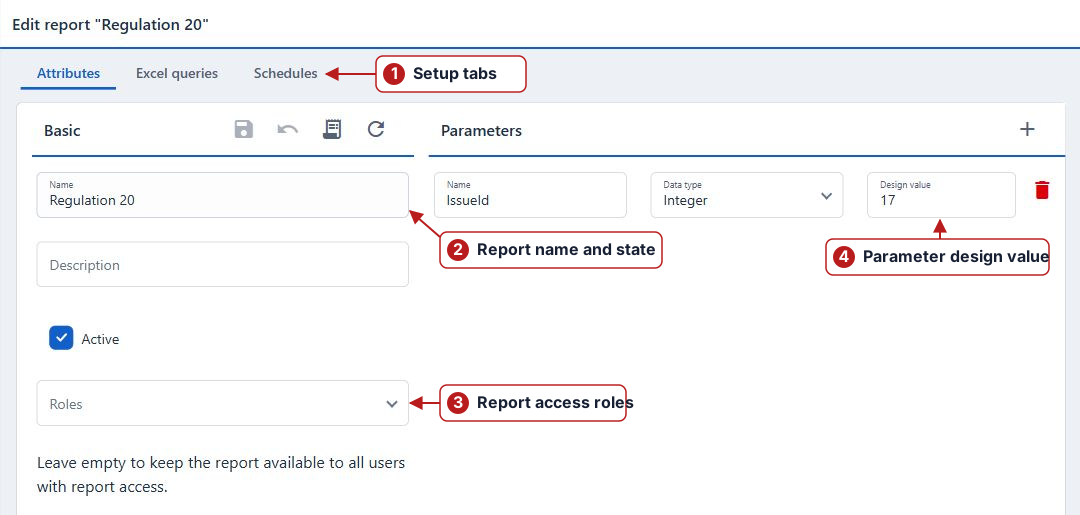
- In the left pane, double-click an existing report or select it and choose More > Edit. To create a report, click the Add new plus icon.
- In Attributes, enter a unique Name and a description. Review Active.
- Under Basic, select Roles to restrict access. Users need any one of the selected roles and the required reporting permissions. Leave Roles empty to allow everyone with those permissions to access the report.
- In Parameters, click Add for each input the report needs. Enter its name, data type and a representative Design value.
- Click the Attributes page’s Save before working with the saved definition’s queries, schedules or template.
Role assignments control who can run a report and access its generated outputs. Users with Setup Reports can manage every definition.
| Input | Where it is used |
|---|---|
| Name and data type | Define the inputs offered when a user runs the report and when a schedule is configured. |
| Design value | Provides a representative input for working on the report template. |
| Run or schedule value | Specifies the actual scope of that report execution. |
Excel queries
The Excel queries tab defines datasets for Excel (from queries) output. Add a query, enter its Name and SQL, then Save. The query name becomes the worksheet name, so use a short, clear name suitable for Excel. Edit or delete queries through the row controls.
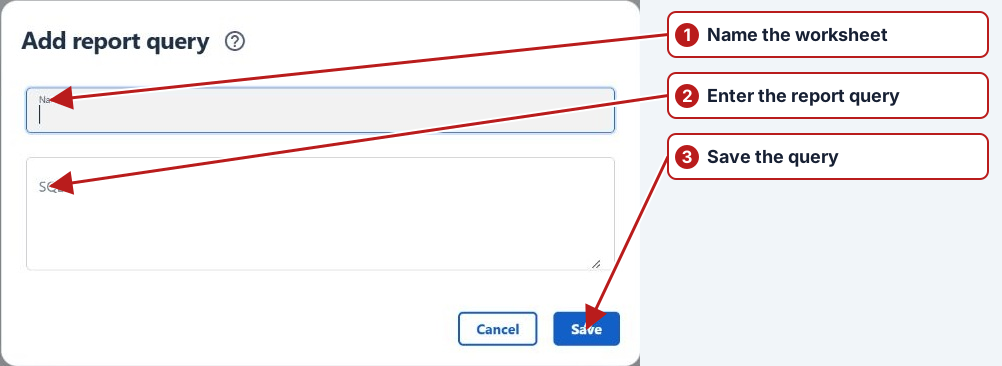
Use SELECT queries and report parameters with matching names, such as @IssueId for the report’s IssueId input. Aquantify validates the query and its parameter references. Choose a dataset and conditions that return the intended records; use explicit units, dates and identifiers in exported data.
Open the template designer
- Save the report definition and its parameter design values.
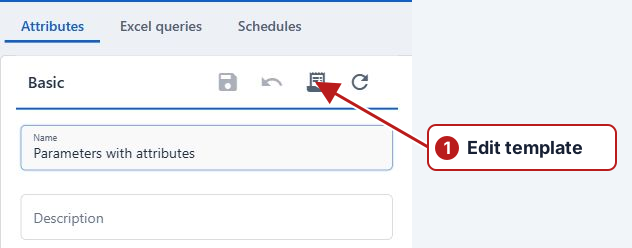
- On the Attributes tab, look at the right side of the Basic header. Click the document icon labelled Edit template in its tooltip. It is immediately to the left of the circular Reset template icon.
- FastReport Online Designer opens. Edit the template, use Preview to check it, and click the designer’s Save icon. Then return to Data > Reports and run the report with representative inputs to check the output.

For bands, fields, formatting and page layout, use the FastReport Online Designer documentation. Aquantify’s guide covers the report definition, inputs, outputs and scheduling.
Maintain an existing definition
Use Show inactive to find disabled definitions. Check existing schedules when changing parameters or datasets; those schedules also need suitable values. Query and schedule dialogs save their changes when their own Save action completes.
See Run reports and Schedule reports.