
Configure a Table widget
A Table displays columns and rows returned by your SQL. Add Table through Dashboard > Configure, then open its Settings.
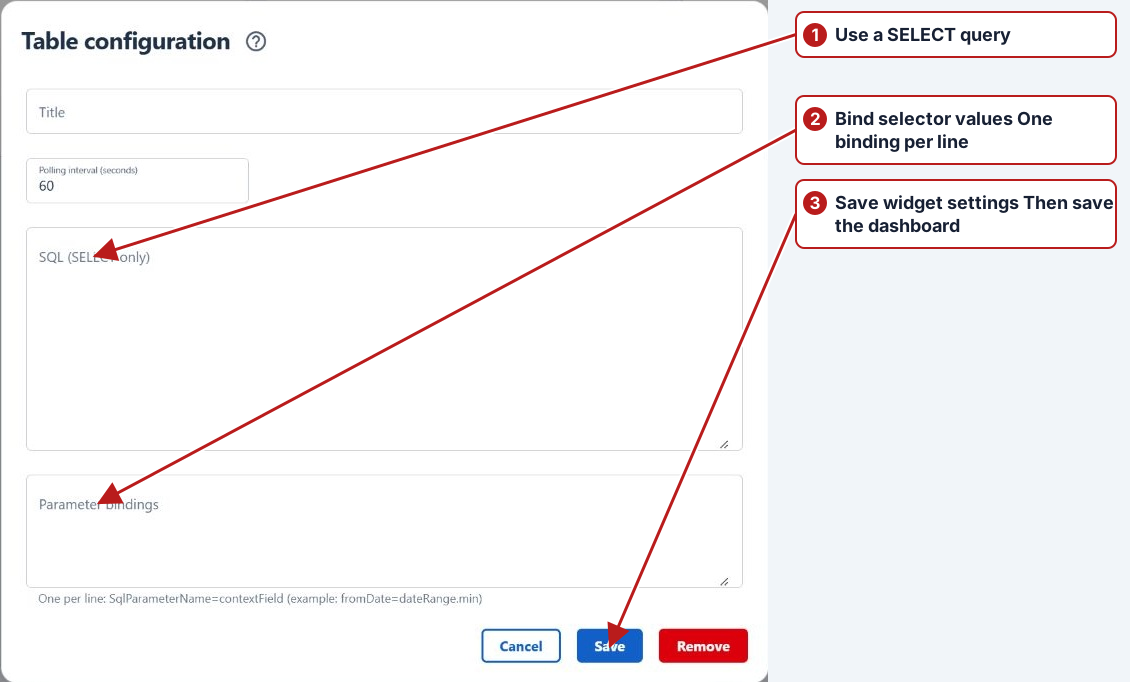
Configuration fields
| Field | Configuration |
|---|---|
| Title | A meaningful heading, such as Monitoring results. |
| Polling interval (seconds) | Greater than 10; default 60. The table also refreshes when a bound selector changes. |
| SQL (SELECT only) | One SELECT. Return the columns you want displayed; Table has no mandatory column names. |
| Parameter bindings | One SqlParameterName=context.path per line. Leave empty for SQL with no parameters. |
Start with a simple query
This standalone example needs no database tables or bindings:
SELECT
    N'Example monitoring point' AS [Sample point],
    CAST(12.5 AS decimal(10, 2)) AS [Reading],
    N'mg/L' AS [Unit];
Each returned column becomes a table heading. Use explicit, distinct aliases and return numeric values as numbers if you want numeric formatting. The table derives its columns from the first returned row; no rows means no column headings. For real data, select the needed fields, filter the scope, limit large result sets with TOP, and use ORDER BY for a predictable order.
Filter with dashboard selectors
For a Date range widget whose Field name is dateRange, enter:
fromDate=dateRange.min
toDate=dateRange.max
Use @fromDate and @toDate in the SQL. The SQL parameters and selector bindings page includes a complete date example, conversion rules and custom-attribute lists. A selector only filters the table when the query uses its bound parameter.
Format columns
While editing the dashboard, open a column’s menu and choose its formatting option. Choose Automatic, Text, Number, Percentage, Date or Date and time. Number and Percentage support decimal places; percentage values are percentage points (return 21.54 to display 21.54%). You can also enable conditional highlighting, choose an operator and colour, and enter a comparison value when required. Apply the column settings and save the dashboard. Keep SQL aliases stable because formatting is stored by column name.
Export data
Use Export CSV in the widget toolbar to download the headings and all loaded rows, including rows outside the visible scroll area. The filename uses the widget title. The export contains the underlying query values, preserving numeric precision; column display formatting and highlighting are not applied. Blank values produce empty cells. Text beginning with a spreadsheet formula marker is prefixed with an apostrophe. Export is unavailable while loading, when there are no rows, or when the query has failed.
Save and check
- Save the widget settings and use Configure > Save on the dashboard.
- Check the returned headings and values.
- Change each bound selector and confirm that the displayed rows change as intended.
- Use Refresh or wait for polling when source data changes.
If the table is empty, check the query scope and selector values. If an error names an undefined parameter, compare every SQL parameter with its binding. For query approval or permission errors, see the SQL guide.
See also Map configuration and all dashboard widgets.